
Nowadays, collecting and storing data from medical visit reports has become easy with the help of new technologies. However, this stored data has no value unless it is actually used. This is generally done through analysis tools, which then produce information and dashboards that help decision-makers to position themselves make the right decisions, and drive success in their strategies. and take the right directions and decisions.
In this post we’ve identified the three most important Dashboards:
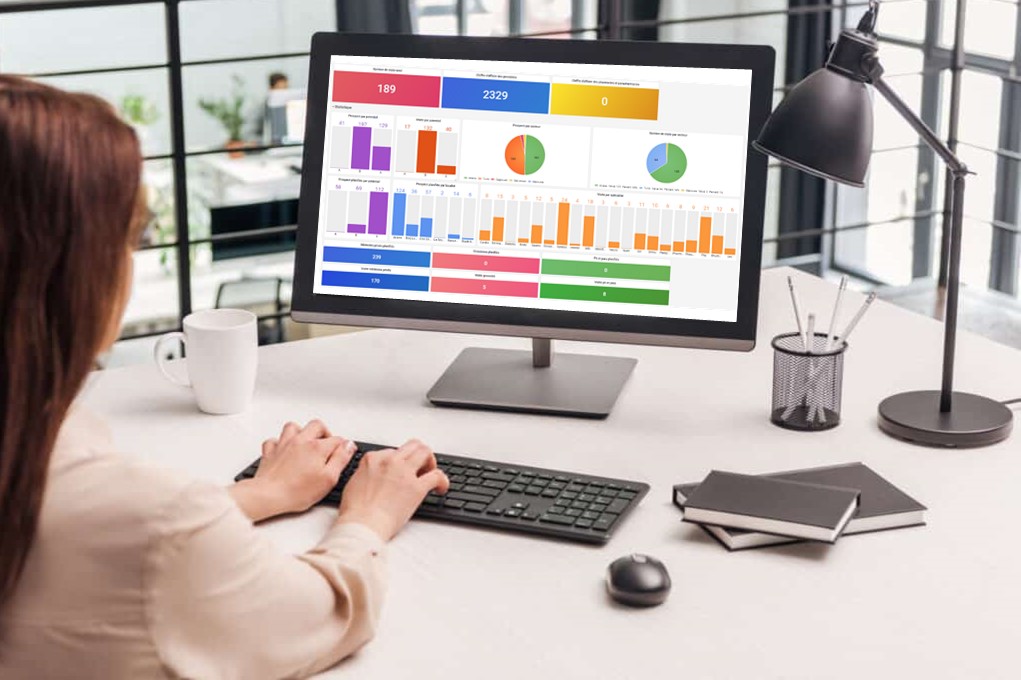
1. General Dashboard
This Dashboard contains a global view of all delegates’ activities, such as number of visits, wholesaler turnover, pharmacy turnover, number of samples, number of freebies, number of visits per specialty per delegate (pharmacy – wholesaler – private doctor – public doctor), number of visits per potential per delegate, number of orders, etc.
2. Delegate profile
This Dashboard should contain all a delegate’s performance indicators, such as the number of planned leads per potential, the number of visits per potential, the number of visits per specialty, wholesale sales, pharmacy sales, number of samples, number of orders, etc.
3. Prospect profile
In this Dashboard, we need to have an idea of the number of visits made to a prospect with dates, number of orders, number of samples, number of freebies, sales, etc.
These Dashboards and more are available in the BirdNotes pharmaceutical laboratory CRM.
An innovative CRM that leverages the power of BI (Business Intelligence) tools to integrate dynamic, on-demand Dashboards to suit your needs.
4. Importance of Data Visualization in Pharmaceutical Sales
Effective data visualization is crucial in the pharmaceutical industry, as it transforms complex data sets into comprehensible insights. Dashboards that present data through charts, graphs, and tables enable marketing and sales teams to quickly grasp performance metrics, identify trends, and make informed decisions. By visualizing data, teams can pinpoint areas needing improvement, track progress toward goals, and respond promptly to market changes.
5. Customizing Dashboards for Target Audiences
Tailoring dashboards to the specific needs of different users enhances their effectiveness. For instance, while sales representatives may require detailed views of their individual performance metrics, senior management might prefer high-level summaries of overall sales trends and market share. Customizable dashboards ensure that each stakeholder accesses relevant information, facilitating better decision-making and strategic planning.
6. Integrating Real-Time Data for Proactive Decision-Making
Incorporating real-time data into dashboards allows pharmaceutical companies to monitor current market conditions and sales activities. Real-time insights enable teams to respond proactively to emerging opportunities or challenges, such as sudden changes in prescription trends or competitor actions. This agility is essential for maintaining a competitive edge in the dynamic pharmaceutical landscape.
By expanding the article with these sections, you can provide a more comprehensive overview of the significance and application of dashboards in pharmaceutical marketing and sales, thereby increasing the word count to meet SEObility’s guidelines.