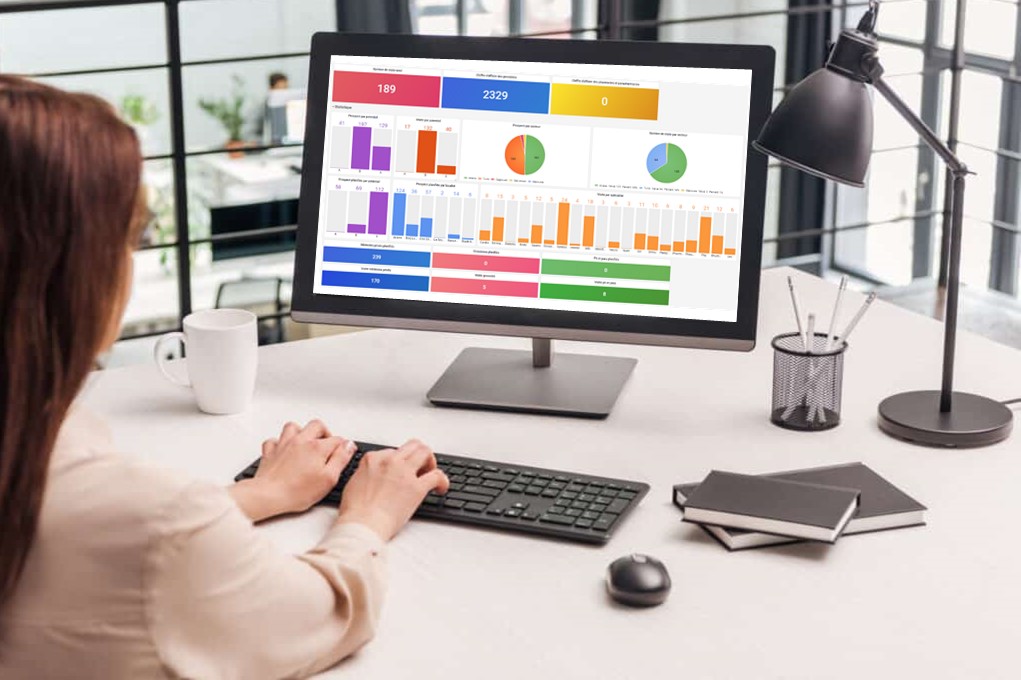
Nowadays, collecting and storing data from medical visit reports has become easy with the help of new technologies. However, this stored data has no value unless it is actually used. This is generally done through analysis tools, which then produce information and dashboards that help decision-makers to position themselves and take the right directions and decisions.
In this post we’ve identified the three most important Dashboards:
1. General Dashboard
This Dashboard contains a global view of all delegates’ activities, such as number of visits, wholesaler turnover, pharmacy turnover, number of samples, number of freebies, number of visits per specialty per delegate (pharmacy – wholesaler – private doctor – public doctor), number of visits per potential per delegate, number of orders, etc.
2. Delegate profile
This Dashboard should contain all a delegate’s performance indicators, such as the number of planned leads per potential, the number of visits per potential, the number of visits per specialty, wholesale sales, pharmacy sales, number of samples, number of orders, etc.
3. Prospect profile
In this Dashboard, we need to have an idea of the number of visits made to a prospect with dates, number of orders, number of samples, number of freebies, sales, etc.
These Dashboards and more are available in the BirdNotes pharmaceutical laboratory CRM.
An innovative CRM that leverages the power of BI (Business Intelligence) tools to integrate dynamic, on-demand Dashboards to suit your needs.
